Market Snapshot: Renewables dominate future electric capacity additions
Connect/Contact Us
Please send comments, questions, or suggestions for Market Snapshot topics to snapshots@cer-rec.gc.ca
Release date: 2021-01-20
Canada’s Energy Future 2020: Energy Supply and Projections to 2050 (EF2020) is the latest long-term energy outlook from the Canada Energy Regulator (CER). The Energy Futures series explores how possible energy futures might unfold for Canadians over the long term under different circumstances. The EF2020 report analyzed two scenarios, Reference and Evolving. The Evolving Scenario assumes that action to reduce the greenhouse gas (GHG) intensity of our energy system continues to increase at a pace similar to recent history, whereas the Reference Scenario assumes limited action to reduce GHGs beyond policies in place today. The graph below shows the historical and projected electricity capacity mix for Canada under the Evolving Scenario.
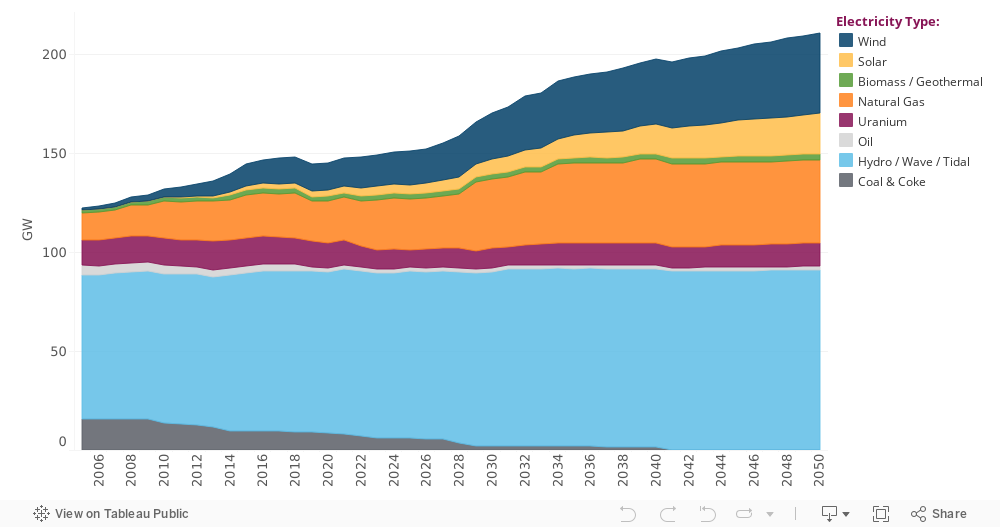
Figure 1. Installed Electricity Capacity 2005 – 2050 Evolving Scenario
Source and Description
Source: EF2020
Description: The stacked area graph above shows Canada’s total installed generating capacity from 2005 to 2050 under the Evolving Scenario. Total capacity in 2005 was 122 GW and increases to 211 GW in 2050.
In the Evolving Scenario, hydro is projected to remain the dominant electricity generation source, making up just over 50% of total installed capacity in 2050. Both solar and wind make strong inroads, as from 2018 to 2050 solar and wind capacity increases from 3 and 21 GW to 13 and 41 GW, respectively. Coal is entirely phased out of the capacity mix over the projection period, decreasing from 9 GW in 2018 to 0 GW in 2050. Coal is replaced by a combination of wind, solar, and natural gas, with natural gas capacity increasing from 23 GW in 2018 to 42 GW in 2050. In comparison to the Evolving Scenario, the graph of the results from the Reference Scenario is shown below.
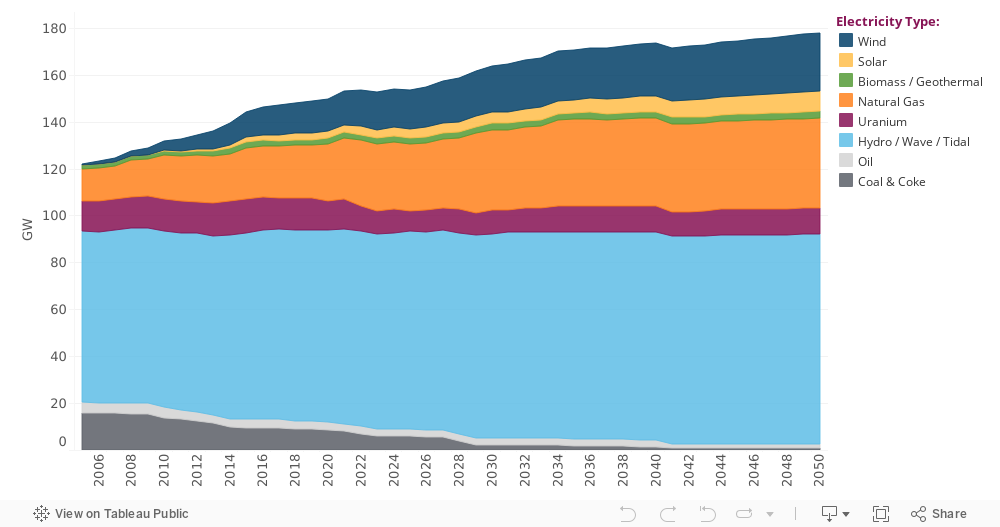
Figure 2. Installed Electricity Capacity 2005 – 2050 Reference Scenario
Source and Description
Source: EF2020
Description: The stacked area graph above shows Canada’s total installed generating capacity from 2005 to 2050 under the Evolving Scenario. Total capacity in 2005 was 122 GW and increases to 211 GW in 2050.
The overall results are similar between the two scenarios, with a few key differences. In both scenarios, coal is phased out and hydro remains the dominant source of electricity. Nuclear capacity retirement and refurbishment schedules are assumed to remain similar in both scenarios.
Total installed capacity is 19% higher in the Evolving Scenario, due to higher electrification of end-use demand, relative to the Reference Scenario. One of the key differences between the scenarios is the much larger additions of solar and wind in the Evolving Scenario. In 2050, wind and solar capacity in the Evolving scenario is 80% higher than the Reference Scenario. This is because the Evolving Scenario assumes lower capital costs for renewables along with a higher carbon price. Natural gas additions are also 10% higher in the Evolving Scenario, due to both the need for capacity to back up the larger renewable additions and higher overall electricity demand.
- Date modified: