Natural Gas Pipeline Transportation System
Overview
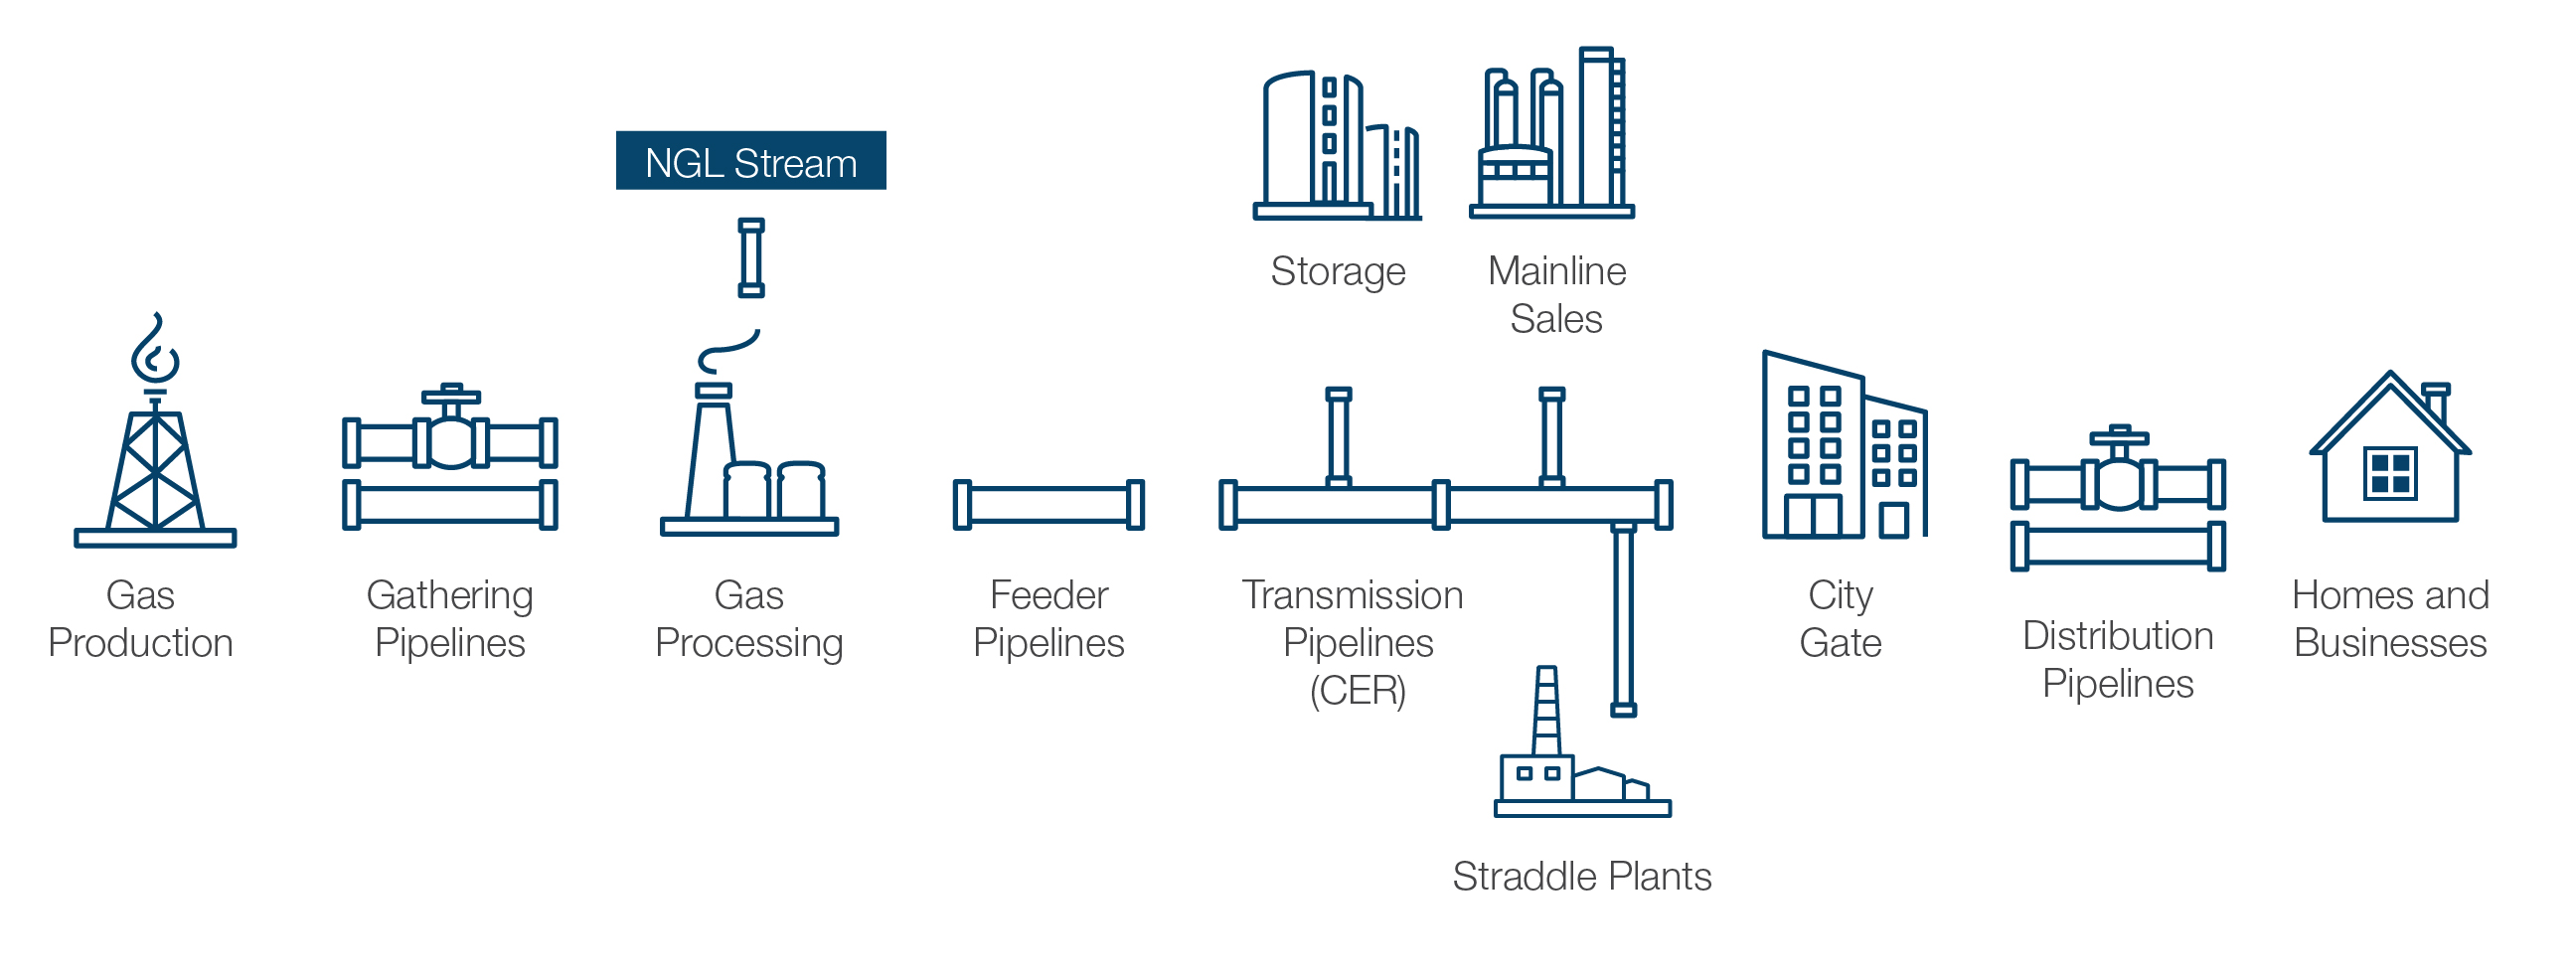
Canada’s natural gas pipeline network is comprised of four main types of pipelines, each playing a vital part in delivering energy to Canadians and export markets:
- Gathering pipelines: move gas from production wells to gas processing facilities, which remove impurities such as sulphur, water, and carbon dioxide. These pipelines are mainly concentrated in the producing areas of western Canada. Provincial regulators typically regulate these facilities.
- Feeder pipelines: transport gas from processing facilities to transmission pipelines, and are also mainly concentrated in the producing areas of western Canada. Provincial regulators typically regulate these facilities.
- Transmission pipelines are the major conduits of the pipeline network, transporting gas to markets, often across provincial or international boundaries. These are typically regulated by the CER.
- Distribution pipelines deliver gas to residences, businesses, and various industries. Provincial regulators typically regulate these facilities.
Figure 14. Gas Pipeline System Overview
Source and Description
Source: CER
Description: This diagram provides an outline of the natural gas system from the point of production, through processing, transportation on feeder and transmission pipelines and ultimately to points of consumption, storage or further industrial processing.
If a pipeline crosses provincial or international boundaries, it is regulated by the CER. This report focuses on transmission pipelines because these are generally the ones crossing provincial or international boundaries. Typically, if a pipeline is contained within a province, it is under the jurisdiction of a provincial regulator unless deemed as a federal undertaking.Footnote 38
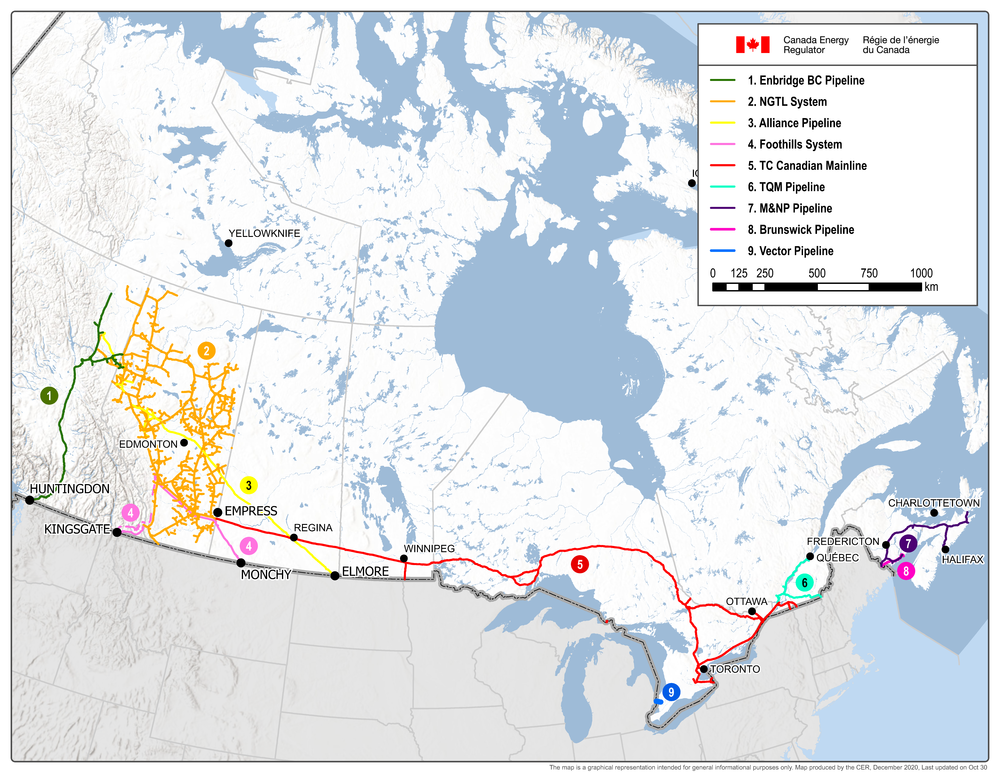
The CER regulates approximately 68 000 km of operating pipelines, including 48 338 km of operating gas pipelines. The map below shows the major gas pipelines regulated by the CER.
Figure 15. Major CER-Regulated Natural Gas Pipelines
Source and Description
Source: CER
Description: This map shows the major CER-regulated natural gas pipelines.
Natural Gas Markets
Canadian Supply and Disposition

In 2019, Canada was the sixth largest producer of natural gas in the world, accounting for 4.3% of global supply.Footnote 39 Canadian natural gas production averaged 15.7 billion cubic feet per day (Bcf/d) or 442 million cubic meters per day (106m³/d) in 2019 and 2020, declining 2.7% from 2018, but still sitting 5.0% above 2015 production. The recent decline was driven by a pull-back in both conventional non-tight and tight gas production, likely owing partly to low natural gas prices in western Canada (see Figure 18 and surrounding analysis). The COVID-19 pandemic did not cause Canadian natural gas producers to meaningfully cut production.
Tight gas production has grown significantly over the past five years and accounted for roughly 66% of total Canadian gas production in 2020. Much of the growth in tight gas production happened because horizontal drilling and hydraulic fracturing have been widely applied to the Montney Formation in Alberta and B.C. Solution gas production has also increased in western Canada because of growing gas production from tight-oil geological formations. Meanwhile, gas production from other formations in western Canada, including conventional non-tight and coalbed methane, have declined over the past five years. Virtually all Canadian natural gas production comes from the WCSB.
Source and Description
Source: CER - Canada’s Energy Future 2020
Description: This graph shows natural gas production by type from 2015 to 2020. Total production in 2015 was 15.0 Bcf/d (424.7 106m³/d), with tight gas making up most of the production at 8.2 Bcf/d (232.2 106m³/d). In 2020, total gas production was up slightly at 15.7 Bcf/d (445.5 106m³/d), with tight gas making up even more production at 10.4 Bcf/d (294.5 106m³/d).
Demand for natural gas in Canada has been rising over the past five years, averaging 10.7 Bcf/d (303.0 106m³/d) for 2020.Footnote 40 Due to large temperature variations between summer and winter months, demand for natural gas is highly variable. In the residential and commercial sectors, demand increases by almost six fold between the months of August and February. The largest source of demand for natural gas in Canada comes from the industrial sector, which includes electric generation and oil sands production. Canada typically exports over 40% of its marketable natural gas production.Footnote 41 In 2020, 43% of the natural gas produced was exported, primarily to the U.S.
Global and North American Natural Gas Markets
Canada’s natural gas market is highly integrated with the U.S. through a vast gas-transmission network.Footnote 42 Mexico is increasingly connected to the U.S. via transmission pipelines, making Canada well-connected within the North American natural gas market.
Canada is a natural gas net exporter with almost all natural gas exports destined for the U.S. The U.S. Midwest region is the main export market for western Canadian natural gas, as it is well-connected to Canada by pipelines and has a large amount of gas-fired electric power generation. Canada also exports gas to the U.S. Rocky Mountains, the Pacific Northwest, and, to a lesser extent, the U.S. Northeast regions.
Between 2015 and 2020, net exports to the U.S. declined by 15%. Aside from the impact of the COVID-19 pandemic, which reduced both natural gas exports and imports, the decline has largely been due to growth of imports in Ontario, Quebec, and the Maritimes. The rise in shale gas production in the U.S. Northeast region has displaced some of the gas traditionally supplied by western Canadian producers. Imports from the U.S. have increased 33% between 2015 and 2019, coming almost entirely from the U.S. East region.
Exports to the U.S. have increased less than 1% between 2015 and 2019, after peaking at 8.2 Bcf/d (232.2 106m³/d) in 2017. Exports have since fallen to 7.4 Bcf/d (209.5 106m³/d) in 2019 and 6.8 Bcf/d (192.5 106m³/d) in 2020. Exports to the U.S. Midwest are mostly responsible for this decline and have fallen to 3.5 Bcf/d (99.1 106m³/d) in 2019, after reaching a high of 4.5 Bcf/d (127.4 106m³/d) in 2017. Demand for Canadian gas was reduced in the Midwest as new U.S. transmission pipelines were built to support U.S. production growth during this period.Footnote 43 After March 2020, the reduction in exports to the Midwest was in part due to low Alberta natural gas storage levels in April, as well as very narrow price differentials, which led domestic gas producers and other market participants to direct more gas into domestic storage rather than export to the U.S.
Source and Description
Source: CER - Commodity Statistics
Description: This figure shows natural gas exports from Canada, by U.S. destination, between 2015 and 2020. In 2020, Canada exported 6.8 Bcf/d (193.8 106m³/d), 2.8 Bcf/d (79.7 106m³/d) of which was exported to the U.S. Midwest border. The U.S. West border received 3.1 Bcf/d (87.8 106m³/d), and the U.S. East border, 0.9 Bcf/d (26.3 106m³/d).
The U.S. Midwest region includes flows that cross the international borders in Alberta, Saskatchewan, Manitoba, and Ontario into Montana, North Dakota, Minnesota, and Michigan.
The U.S. West region includes flows that cross the international borders in British Columbia into Washington and Idaho.
The U.S. East region includes flows that cross the international borders in Ontario, Quebec, and New Brunswick into New York, Vermont, and Maine.

The competition for U.S. market share in recent years has led many Canadian producers to look for new markets overseas, particularly through liquid natural gas (LNG) export proposals. Numerous LNG export projects have been proposed on the West Coast and in eastern Canada over the past decade and have been granted export licenses from the CER or NEB. However, as of 2021, only one export project, LNG Canada, is being constructed, with other projects remaining in various stages of development. Several projects have also been put on hold or cancelled in recent years, in part due to unfavorable market conditions such as low global LNG prices and large capital costs. Most proposed LNG projects in Canada require building new long-distance pipelines to supply gas, which further adds to the capital costs of Canadian LNG projects.
While large-scale overseas exports of LNG from Canada are still some years away, small-scale LNG plants in Canada export small volumes of LNG to the U.S. by truck and to China by marine transport in specialized containers.Footnote 44 In 2020, total LNG volumes exported (measured in gas equivalent) was 11.0 106m³ compared to 21.8 106m³ in 2019. The decline in LNG export volumes was driven by a reduction in exports to China and the U.S.
Impacts of COVID-19 on Natural Gas Markets
The COVID-19 pandemic significantly affected global LNG markets. Weakened demand for LNG resulted in lower LNG prices and reduced LNG trade. U.S. LNG exports declined by more than half from a record of 9.8 Bcf/d (260.5 106m³/d) in late March 2020 to an average of 3.1 Bcf/d (87.8 106m³/d) in July 2020.
The significant decline in U.S. gas production helped re-balance the North American gas market during 2020, and more than offset the drop in North American natural gas demand and LNG exports. As a result of the large decline in supply of U.S. gas produced from primarily oil-producing wells (known as associated gas), North American gas prices were not as impacted as oil prices.
By late 2020, global LNG prices and demand largely recovered, and U.S. LNG exports recovered to pre-COVID levels and reached a new record of 9.84 Bcf/d (278.6 106m³/d) in January 2021. However, U.S. production has not fully recovered yet. January 2021 U.S. production averaged 92.4 Bcf/d (2 616 106m³/d), 5 per cent below peak production recorded in December 2019.
The pandemic has contributed to delays or construction disruptions to two LNG projects in Canada: LNG Canada and Woodfibre.
Market Dynamics
Natural gas prices are determined at physical locations (hubs), which are usually located near natural gas storage facilities, or at transfer points between connecting pipelines. Canadian natural gas is typically priced as the difference between a Canadian hub and the continental benchmark, Henry Hub, which is located in Louisiana. This difference between prices is known as the basis differential. The basis differential between two or more price hubs is affected by pipeline transportation cost, supply and demand dynamics, and general market sentiment.
The NOVA Inventory Transfer (NIT) is the pricing point used for natural gas sourced from the WCSB. NIT is a natural gas trading hub located in Alberta and is the commercial mechanism that overlays the Nova Gas Transmission Ltd. (NGTL) pipeline network. It is connected to several export markets via interconnected pipelines and connects to multiple storage facilities in Alberta. Other commonly quoted reference points for natural gas prices in Canada are at the natural gas storage and transportation hub near Dawn, Ontario, as well as at Station 2 on the Enbridge BC Pipeline.
North American natural gas prices tend to be lower near supply basins and higher near demand centers. This is because there is always a pipeline transportation cost to ship natural gas between production wells and the end users. Figure 18 shows how Alberta-NIT and B.C. Station 2’s prices typically trade below Henry Hub prices, whereas prices in the consuming region of Dawn typically track much closer to Henry Hub prices.
Source and Description
Source: SP&P Global Platts.
Description: This figure shows natural gas prices at the major hubs in Canada and the U.S. North American natural gas prices tend to be lower near supply basins (Alberta NIT and Station 2) and higher near demand regions (Dawn and Henry Hub). Alberta NIT and B.C. Station 2’s prices typically trade below Henry Hub prices, whereas prices in the consuming region of Dawn typically track much closer with Henry Hub prices.
The basis differential between Alberta-NIT/B.C. Station 2 and Henry Hub were relatively wide and volatile between 2017 and late 2019, as a combination of constraints on pipeline capacity and a lack of access to seasonal storage in western Canada caused local markets to become oversupplied. As a result, local spot prices were extremely low, particularly during the summer months, and went negative on some trading days in 2017 and 2018. Because the pipeline constraints were located downstream from the producing area, and storage injection access was limited, producers were forced to shut-in production and paid shippers to take their natural gas. Over the same period, Henry Hub prices were much higher and relatively stable, reflecting that the constraints were localized to western Canada. Beginning in late 2019, the markets began to reconnect and prices in western Canada have tracked Henry Hub much more closely, following additional capacity on the NGTL system.
Natural gas prices at Henry Hub and Dawn have been declining since late 2018 and continued to fall over the course of the first half of 2020 to the lowest levels seen in decades. A milder 2020 winter in major gas consuming regions, combined with lower demand resulting from the COVID-19 pandemic, partially explain the decline in prices. In February 2021, prices increased due to extreme weather in the U.S. that led to natural gas supply and demand imbalances. Particularly, there were temporary interruptions to natural gas production caused by the cold weather, amid high demand for heating and power.
Meanwhile, western Canadian natural gas prices started to rise significantly in the fall of 2019 prior to the COVID-19 pandemic, and have remained higher throughout 2020 and 2021 compared to the past several years.
Pipeline Capacity and Utilization
Changes in natural gas markets have significantly impacted pipeline flows in recent years. Some pipeline segments have become fully utilized and seen market demand for additional capacity, while other segments have become underutilized seasonally or year-round. Further, some segments have partially or fully switched from exporting natural gas to the U.S., to bringing in imports. As a result of these changes, services offered by pipeline companies have evolved.
Unique Pipeline Service Offerings
The CER encourages companies to be innovative with the services they offer, including in response to changes in energy markets. This is shown by some new pipeline transportation services that have been brought forward to, and approved by, the CER.
Starting around 2008, TC Canadian Mainline utilization decreased at the Prairies and Northern Ontario Line points. Less natural gas was flowing east from the WCSB for delivery into Ontario, Quebec, and the U.S. Growth of unconventional production in Pennsylvania and Ohio meant customers increasingly turned to closer, lower-cost natural gas supply. As part of its response, TransCanada PipeLines Limited (TCPL) designed long-term fixed price (LTFP) offerings for routes along the TC Canadian Mainline, including services to Ontario and Herbert, Saskatchewan.
Under the Dawn LTFP service, approved by the NEB in October 2017, 23 shippers subscribed to transport 1.5 petajoules per day (PJ/d) of natural gas from Empress, Alberta to Dawn, Ontario, for a ten-year term, at a fixed price of $0.77 per gigajoule (/GJ). Under the Herbert LTFP service, approved by the NEB in July 2017, one shipper subscribed to transport 58 terajoules per day (TJ/d) from Empress to the Herbert delivery point in Saskatchewan for a ten-year term at a fixed price of $0.12/GJ. Under the North Bay Junction service, approved by the NEB in May 2019, 17 shippers subscribed to transport 0.67 PJ/d from Empress to North Bay Junction, Ontario, for terms ranging from 10 to 20.5 years, at a fixed toll of $0.93/GJ.
The NEB approved new services and tolls for the Alliance Pipeline in 2015. This set fixed long-term firm tolls and gave Alliance Pipeline Ltd. (Alliance) discretion in setting bid floors for seasonal firm service between 100% and 125% of the applicable five year firm toll, and up to 125% for interruptible service. By the time the new services were implemented in December 2015, the pipeline was fully contracted under the proposed toll framework.
The NEB also approved the T-South Winter Firm Service on the Enbridge BC Pipeline in 2016. This new service is for natural gas delivered from Station 2 to the Huntingdon area from November to March. About 0.16 Bcf/d (4.5 106m³/d) of additional pipeline capacity is available during these months because they are cooler than the rest of the year, allowing more gas to flow. This would have otherwise been offered as interruptible service.
Ontario and Maritimes Import-Export Flow Changes
Due to growing natural gas production in the U.S., some export points on the TC Canadian Mainline in Ontario were changed so natural gas could be imported. The TC Canadian Mainline’s Niagara point has imported natural gas since 2012, and its Chippawa point has imported natural gas since 2015. Both points were former export points that were reversed so natural gas could flow into Ontario from the Marcellus and Utica shales of the Appalachian Basin. In 2017, TCPL also changed the Iroquois, Ontario point so gas could flow bi-directionally. While Iroquois continues to primarily export gas, it has periodically imported gas from 2018 onward.
The Maritimes was once supplied by natural gas produced in offshore Nova Scotia, with some volumes of gas imported during peak times from the U.S. and globally from the Canaport LNG terminal in New Brunswick. Nova Scotia’s offshore natural gas production declined since 2014 and was finally shut down in mid-2018 (see section “The End of Natural Gas production in the Maritimes”). Since 2015, natural gas has been increasingly imported through St. Stephen, New Brunswick, from the U.S. on the bi-directional M&NP Pipeline.Footnote 45 Today, St. Stephen primarily imports natural gas, after mostly exporting until 2015. Further, fewer LNG cargoes are being imported from overseas to the Canaport LNG terminal, which has led to underutilization of the Brunswick Pipeline.
Ex-WCSB Pipeline Throughput
Figure 19 shows the volumes of gas leaving the WCSB by pipelines to domestic and export markets, along with the aggregated (total) pipeline capacity.Footnote 46 Key points along pipelines within the WCSB are full while some key points they connect to just outside this region have spare capacity. This means more gas could be exported if those bottlenecks within the WCSB were removed. For example, NGTL is currently increasing capacity in the Peace River production area of its systemFootnote 47 to accommodate growing production. Gas from the East Gate of the NGTL System can flow into the TC Canadian Mainline and the Foothills System’s Saskatchewan zone, both of which have substantial spare capacity.
Some proposed or constructed projects in the Peace River area are described in Proposed Pipelines and Expansions section. Links to various project filings, which include applications and supporting evidence, CER recommendations, final approvals, and certificates are also in the Proposed Pipelines and Expansions section below.
Source and Description
Source: Open Government, Throughput and Capacity Data as reported to the CER through compliance filings from regulated companies.
Description: This graph shows the volumes of natural gas leaving the WCSB production areas (British Columbia, Alberta, and Saskatchewan) between January 2015 and March 2021 on an average monthly basis. Stacked pipeline throughputs are shown in the area chart for the following points: Alliance Pipeline’s border point, NGTL System’s West Gate, NGTL System’s East Gate, and the Enbridge BC Pipeline’s Huntingdon export point and Lower Mainland delivery area. The aggregated capacity of those points are also shown.
The End of Natural Gas Production in the Maritimes
In 2018, Nova Scotia’s offshore natural gas production ended after nearly 20 years. The Sable Offshore Energy Project (SOEP) started producing gas in late 1999 and Encana’s Deep Panuke started in 2013. When SOEP started, most of its natural gas production was exported to New England on the M&NP Pipeline while also supplying the (then) new Maritimes gas market. Imports into the Maritimes on the M&NP Pipeline were sometimes required during peak winter demand times. These would include imports from the U.S., as well as supply delivered to the Canaport LNG facility in Saint John, New Brunswick and transported on the Emera Brunswick Pipeline.
As Nova Scotia’s production declined, so did gas exports at St. Stephen, New Brunswick; surplus gas once exported from the region dwindled. As production continued to decline, more volumes of gas had to be imported into New Brunswick on the M&NP Pipeline to serve the Maritimes market (Figure 20). In 2021, the Maritimes is entirely a natural gas importer due to lack of domestic production. LNG cargos are imported primarily to meet seasonal winter demand.
Source and Description
Source: CER, Canada-Nova Scotia Offshore Petroleum Board.
Description: The figure shows Nova Scotia’s offshore natural gas production and natural gas exports at St. Stephen. In 2009, exports at St. Stephen averaged 200 thousand cubic feet per day (MMcf/d) (5.7 million cubic metres per day or 106m³/d), and offshore natural gas production averaged around 400 MMcf/d (11.3 106m³/d). Around 2013/2014, exports increased after offshore production from Deep Panuke began (exports reached 300 MMcf/d, or 8.5 106m³/d, and total offshore production reached nearly 500 MMcf/d or 14.2 106m³/d). Within months, offshore production declined again. The graphs show when offshore production ended in 2018, imports at St. Stephen significantly increased. Imports at St. Stephen started growing during the period of declining production, and almost all gas was imported by 2017. In 2020, imports at St. Stephen reached approximately 200 MMcf/d (5.7 106m³/d).
Natural Gas Capacity Utilization
Technical Background
Natural gas flows through transmission pipelines under pressures between 5 000 to 14 000 kilopascals. Compressor stations ensure natural gas flows through the system by setting pressures from higher to lower along pipelines. Pipeline diameters and system design also play key roles in optimizing pressure, throughput, and ultimately, pipeline capacity.
Limited capacity at key points within a network of natural gas pipelines often has widespread effects within a region and potentially within a larger, continental market. For example, pipeline bottlenecks downstream of important receipt points in producing areas can limit how much additional natural gas can be injected into pipelines or storage. Meanwhile, delivery points downstream of a pipeline bottleneck might not receive enough natural gas, especially during high-demand periods.
Capacity Utilization at Key Points
Figure 21 shows key points on major Canadian pipelines where throughput and capacity are reported to the CER. Some of these are export points along the international border (for example, Huntingdon and Monchy), while others are key import points (Niagara and St. Stephen). Additionally, some key points are within western Canada, such as the NGTL System’s Upstream James River receipt point (in Alberta’s northwestern production area) and the NGTL System’s West Gate.
Source and Description
Source: CER - Pipeline Profiles
Description: This figure shows average throughput and capacity at key gas pipeline points. The blue columns represent capacity and the orange columns represent throughput. The export points shown are: Huntingdon (Enbridge BC Pipeline); Kingsgate (Foothills System); Upstream James River (NGTL System); West Gate (NGTL System); Prairies (TC Canadian Mainline); Monchy (Foothills System); Border (Alliance Pipeline); and Iroquois (TC Canadian Mainline). The import points shown are: Niagara (TC Canadian Mainline) and St. Stephen (M&NP Pipeline).
Capacity Changes
Changes in a pipeline’s pressure can affect capacity and throughput of natural gas pipelines. The capacity of a natural gas pipeline is based on many factors, such as the direction of flow, ambient temperature, pipeline compression, and maintenance work or other pressure restrictions. Companies can also add or decrease capacity at various points of their systems as supply and demand changes.
Pipeline operators have a few options to increase the volume of gas that can flowFootnote 48 through the pipe, including adding pipeline loops (connecting an additional pipeline that runs parallel to an existing pipeline) and increasing compression (increasing pressure so more gas can flow through the same amount of space). Conversely, capacity can be decreased at points where not enough natural gas is flowing or where a pipeline has integrity issues. Finally, if a pipeline, or one of its sections, is no longer economical to operate as gas flow becomes too low to justify running it, companies can file for decommissioning and/or abandonment of an entire line or section. For example, after the Maritimes offshore gas fields permanently shut down, the subsea pipelines to the onshore gas plant were no longer needed, and the CER approved the abandonment.
Proposed Pipelines and Expansions
The CER has approved many natural gas pipeline projects over the last five years. The majority of these projects were proposed by NGTL to add capacity in key areas of its system. These key areas include the Peace River Project Area,Footnote 49 where WCSB gas production has been growing, as well as areas where NGTL delivers gas to pipelines outside its system. Growing B.C. production has also caused Westcoast Energy Inc. (Westcoast) to propose some upgrades for its Enbridge BC Pipeline, which delivers gas produced in northeast B.C. to the NGTL System, as well as to customers in southern B.C. and the U.S. via the Huntingdon export point.
Between 2015 and 2020, NGTL filed nearly 100 applications for pipeline projects to the CER, including expansions.Footnote 50 In comparison, project applications from other major CER regulated natural gas companies are relatively lower, with TCPL filing 22 applications, Westcoast filing 21, Alliance filing two, Foothills Pipe Lines Ltd. filing two, Maritimes & Northeast Pipeline Management Ltd. filing none, and Emera Brunswick Pipeline Company Ltd. filing none.
NGTL System: WCSB Production Area
NGTL is upgrading its system as natural gas production continues to grow from unconventional and tight gas plays in west-central Alberta and northeast British Columbia. These capacity additions will transport growing production to markets both inside and outside of Alberta. Several projects came into service in 2020 or are proposed to be built in 2021 in the Peace River production area of the NGTL System.Footnote 51 For example, NGTL has proposed several looping projects in order to increase capacity along its Grande Prairie Mainline and Northwest Mainline. Several compressor station upgrades in this area have also been proposed within a similar timeframe, including upgrades at Clearwater and Nordegg. Capacity upstream of the NGTL System’s James River Receipt point has increased steadily since 2011 as a result of expansions.
NGTL System: East and West Gates
NGTL has also proposed projects to increase gas deliveries to its system’s border points (known as East Gate and West Gate). These projects include:
- The West Path Delivery Project, completed in 2020, upgraded part of the Rocky View section of the Western Alberta System Mainline near Calgary, as well as added unit additions at the Turner Valley and Burton Creek compressor stations. This project increased the amount of gas flowing to West Gate and increased export capacity at the Alberta-B.C. border from 2,576 MMcf/d (72.9 106m³/d) to 2,845 MMcf/d (80.5 106m³/d).
- The West Path Delivery 2023 Project is proposed to be built in 2023. It is also intended to increase the amount of gas flowing towards the NGTL System’s West Gate. It consists of loops to expand the Turner Valley, Longview, and Lundbreck sections of the Western Alberta Mainline, which flows into the interconnected Foothills System’s B.C. zone at the West Gate.
- The 2021 NGTL System Expansion Project proposes to loop eight sections along the Grande Prairie and Edson Mainlines and upgrade three compressor stations. These expansions are proposed to be completed throughout 2020 and 2021. The project would increase deliveries towards Calgary and its surrounding area as well as to export markets via East Gate.Footnote 52 From there, natural gas can serve demand in several regions including Ontario, Quebec, and the U.S. Midwest via the TC Canadian Mainline.
At times, companies can decrease capacity in response to changing market demand. In 2013, NGTL reduced capacity at East Gate because of growing intra-Alberta gas consumption, particularly in the oil sands, and declining contract demand quantities at East Gate. The CER’s NGTL Pipeline Profile shows that East Gate capacity decreased towards the end of 2013 from 6.6 Bcf/d (187 106m³/d) to around 5 Bcf/d (142 106m³/d).
Enbridge BC Pipeline: T-South and T-North Expansions
Most of the new production growth in the WCSB is from northeastern B.C.’s production areas. The Enbridge BC Pipeline transports the gas it receives from northern B.C.’s pipeline gathering system towards intra provincial and export markets.
In 2019, the NEB approved applications related to the T South Reliability and Expansion Program (Program) which involves compression and reliability upgrades at various points along the Enbridge BC Pipeline. The Program includes the T-South 2018 Compressor Station Applications as well as the T South Expansion and Reliability Project application. The numerous compressor stations to be upgraded include: CS-3 (MacLeod Lake), CS 4A (Summit Lake), CS 5 (Kersley) as part of the T South 2018 Compressor Station Applications; and CS-4B (Hixon) and CS-6A (150 Mile House) as part of the T-South Expansion and Reliability Project application.
The Program will increase capacity at the Enbridge BC Pipeline’s Huntingdon meter station at the Canada/U.S. border. From Huntingdon, natural gas can flow towards the Vancouver area and Lower Mainland or into the U.S. Pacific Northwest via an interconnecting pipeline. In 2020, Westcoast completed a portion of this Program and put it in service. In 2015, Westcoast also applied for upgrades at the following compressor stations in the Enbridge BC Pipeline’s T South zone which have since been completed: CS-6B (93 Mile House), CS-8A (Kingsvale), and CS-9 (Rosedale).
Additionally, Westcoast has either recently completed or received CER approval for several projects in its northern zone (T-North) in order to accommodate growing production in northeast B.C. These compression and reliability upgrades would enable more gas to be delivered further south along the Enbridge BC Pipeline, transported to the NGTL System. The projects completed in recent years in T North include: the Wyndwood Pipeline Expansion Project, the Jackfish Lake Expansion Project, the High Pine Expansion Project, and the Spruce Ridge Program.
- Date modified: